14 Oct 2025
We saw a dramatic drop in a customers Google Search Console. When we shared it with them, we needed to tell them a drop in impressions isn't always a cause for panic, but a sign of powerful SEO progress, particularly if you've made an intentional change and your click-through and average position show improvement.
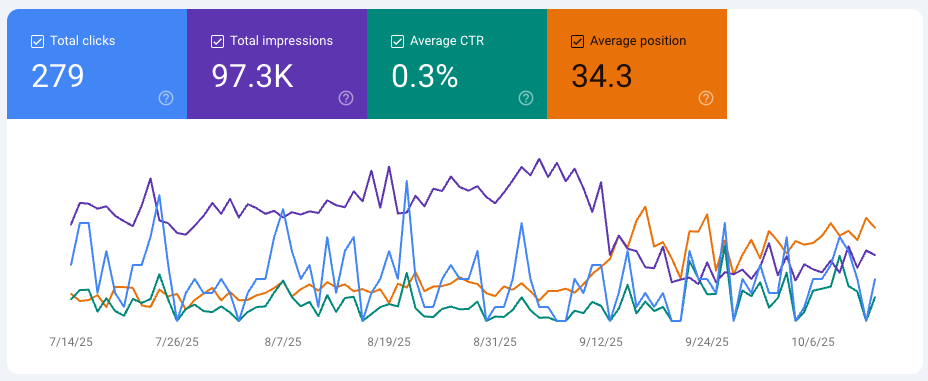
The graph below shows a significant drop in overall impressions for this website in September 2025 - A massive drop in impressions in fact. And it was an intentional drop in impressions, too. (That is the purple line)
But if you look at the blue, green and orange lines, you are seeing both a convergence, an increase and an important ratio shift.
Fewer impressions, better ranking, more consistent clicks and an improved click-through rating.
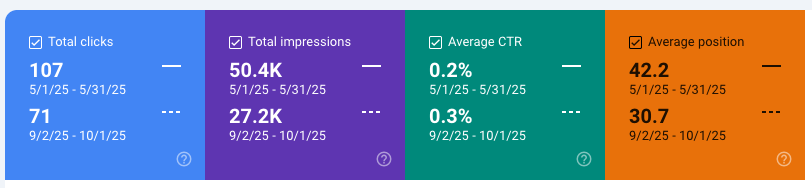
Comparing May 2025 to September 2025
Let's dive a little deeper into a specific comparison. May 2025 to September 2025.
-
This website now gets 1.23× more clicks per impression.
-
Average position of search results improved, confirming better quality traffic exposure.
-
While there is a reduction in clicks overallis thus is mostly due to fewer search appearances, not weaker performance
Decoding the Ups and Downs: What Search Console Graphs Really Show
At first glance, a dramatic drop or spike in your Google Search Console graph might induce a sense of panic. However, these fluctuations are often indicative of deeper, more meaningful changes in your site's performance. It's essential to understand that these graphs don't just reflect raw numbers but also represent user behaviour, search trends, and algorithm updates.
For example, a spike in impressions might suggest that your content is being shown to a broader audience due to a trending topic or effective keyword optimisation. Conversely, a drop might indicate a seasonal shift or a change in search engine algorithms. Understanding these dynamics can help you decipher the true story behind the numbers.
Common Misconceptions About Search Console Data
Many marketers are overly concerned with impressions, believing that higher impressions directly correlate with success. However, impressions alone don't tell the whole story. More critical metrics include your site's average position in search results and the click-through rate (CTR).
A high number of impressions with a low CTR may indicate that while your site is being seen, it isn't enticing users to click. This could be a sign to refine your meta descriptions or to better align your content with user intent. On the other hand, a lower number of impressions with a high CTR often signifies that your content is highly relevant to a specific audience, which can be incredibly valuable for targeted marketing efforts.
Hidden Opportunities Behind Alarming Trends
What might initially seem like alarming trends in your Search Console data can actually be golden opportunities. For instance, a sudden drop in impressions might push you to investigate and uncover valuable insights about your audience or emerging search trends. A drop that isn't related to an intentional change should be a concern. But a drop related to an intentional shift in targeting could like the example above reflect a successful shift in your strategy.
This success happened because we noticed a spike in a particular keyword's performance, so we double down on that topic with more content or improved SEO strategies.
These 'alarming' trends often serve as a catalyst for deeper analysis and strategic adjustments that can lead to significant gains.
Actionable Steps to Leverage Your Search Console Insights
To turn potential panic into progress, start by regularly monitoring your Search Console data with a focus on CTR and average position, not just impressions. Use these metrics to identify areas for improvement.
Next, conduct A/B testing on meta descriptions and title tags to see what drives higher engagement. Also, consider segmenting your data by device or geography to tailor your content more effectively.
Finally, stay updated on industry trends and algorithm changes to anticipate shifts that could affect your metrics. By being proactive and data-driven, you can transform concerning graphs into a roadmap for SEO success.

About your Author
Keinen
Keinen is our Studio Director and courageous leader. His passions lie in harnessing design and technologies to solve and improve customer and user experience. Keinens’ experience spans service delivery, product management and business management. Having delivered SAAS solutions for Global enterprise and worked with hundreds of local businesses to establish their success online.